Long treasury bond yields in the US fell to another new low on the year today with the 30-year settling at 3.01% and the 10-year settling at 2.28%. We've been highlighting all year the positive correlation between the rate of change in the Fed's balance sheet and long bond yields (when the balance sheet expands at a slower rate bond yields tend to fall) and it appears that relationship is still firmly in place as the first two charts below show.
We also point out that the main driver of the decline in rates has been a rerating lower of TIPS implied inflation rates (chart 3 below) to a level not seen since the end of 2011.
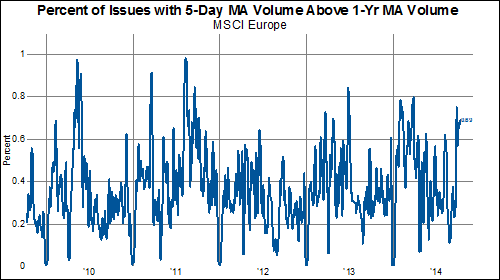
Volume of shares traded in MSCI Europe have picked up recently. Slightly less than half of the constituents have their 50-day moving average exceeding the one year moving average. When we look at 20-day and 5-day moving averages, the proportion jumps to more than 60%--and close to 70%.
This uptick in volume as shares slide makes us wonder if the number of down days has put in a low. In some cases over the past few years, days down by 1% or more has tripled in just a couple of months' time.
Are we headed for an acceleration to the downside in Europe?
GaveKal Capital's Eric Bush looks at the strength of the dollar and its impact on sales estimates and revisions for global equities. If present trends continue, the team expects we could see further deterioration.
According to the most recent data available, the IMF estimates that central banks around the world shifted quite a few of their reserves out of the euro in Q2. While Europe's common currency as a proportion of total reserves has remained fairly constant over time, last quarter's decline is the second largest since the euro's inception.
What may have precipitated such a large shift? Perhaps central banks are not too keen to pay interest on those euro-denominated assets--a condition imposed by the ECB when it cut its Deposit Facility interest rate to -0.10 in early June.
A second cut to the deposit rate in September--combined with short-term yields in a number of European countries falling below zero--would not seem to bode well for a reversal in central banks' preference for holding euros.
In the table below, we show the percent of companies from each country that are outperforming the MSCI World Index. While 62% of Hong Kong, US and Danish companies are outperforming, only 7% of the companies in Germany and Sweden are outperforming.
What is causing such a divergent performance among the developed world countries? The simple answer is the rising US Dollar. Since July 2011, when the USD made a low and began a new structural bull market, stock market performance has largely been a function of the oscillations of the USD. To punctuate the narrowness of leadership in the global equity markets, we created a diffusion index to measure the number of countries outperforming the MSCI World index over various time periods. Only 2 countries--the US and Denmark--have outperformed the MSCI World index over the last five years. Only four countries have outperformed over the last three years. Needless to say, stock picking in a globally diversified portfolio has been difficult.
In the chart below we show the 100 day moving average of the advance/decline ratio of the MSCI World Index. Stock market breadth peaked four months after the USD troughed and each wave of USD strength has led to another wave of narrowing stock market breadth. No surprise that new highs in the USD are occurring alongside new lows in the advance/decline ratio.
Another way to think about the narrowing of stock market leadership is to break companies into two basic categories--cyclicals and non-cyclicals. Over the last 15 years, the movement of the USD has largely dictated which group outperforms. In the years of the USD bear market, cyclical stocks handily outperformed cyclicals. Since testing 2008 lows in 2011, the USD has been rising and has been accompanied by non-cyclicals outperforming.
Since non-cyclicals represent only about 25% of the companies in the MSCI World Index, when non-cyclicals are outperforming, it stands to reason that breadth statistics are weak. In a strong USD environment, North American non-cyclicals are the place to be.
It was only a few months back when we began feverishly highlighting here, here, here, here, here, and here how volatility in many markets was at or near generational lows and that any move to return to the mean would be disruptive. Several months on, it now seems that volatility in those markets had indeed put in its lows as our volatility indicators have all moved higher in the last few weeks. The relationship between our FX volatility indicator and the VIX has remained in place too (last chart), which portends a more interesting equity market if FX volatility were to continue its march higher toward its long-term mean.
One of our favorite grounding exercises is to peruse our chart library and review what has happened in the global financial markets so we can opine about what those prices and patterns are telling us about the world. We'll save the opining for another time, so we present the following charts with little commentary.
Stock Market:
Global stocks have fallen recently, led by cyclical sectors and Europe. The US is the best performer of a major economy by a mile:
EM performance not so good either and now underperforming DM over the last month:
From a country perspective, market leadership is at a major low according to our breadth indicator measuring the number of DM countries outperforming the MSCI World Index:
The Draghi "whatever it takes" trend line has been clearly broken:
Small caps badly underperforming:
As counter cyclical stocks pivoted higher relative to cyclical stocks:
Thanks in large part to European cyclicals:
But also helped by Japanese cyclicals:
North American counter cyclicals have been a good place to hide:
Market breadth is fading quickly:
Especially in Europe and Asia, but also in NA and EM:
North American Health Care doing just fine, however:
North American Staples not so bad either:
The percent of stocks with positive performance is shooting lower:
And the percent of stocks outperforming remains near the lows:
Which makes it easy to see why the median stock fared much worse than the overall index in Q3:
Almost a quarter of DM stocks are in a bear market:
And 61% are in a correction:
Worse in the EM:
Europe takes the cake though with 42% of stocks in a bear market and 85% in correction:
Japan is making all efforts to catch down to Europe:
Equity volatility seems to have put in a low:
Bond Market:
The 30-year made new 1-year lows yesterday:
Keeping intact the long-term downtrend in yields:
Same goes for the 10-year (though the 10-year is just at the lows for the year):
Which means our model showing Fed tapering and lower yields remains in effect:
The drop in rates is all due to lowered inflation expectations:
Though real rates have fallen a little too:
The bear flattener at the long end continues:
Which is good news for the USD:
But not so good for junk spreads:
Speaking of which, junk spreads continue to widen:
Which is not good news for stocks as they share the same low position in the capital structure:
BAA spreads hanging in there ok:
Munis ok too:
The asset backed commercial paper market continues its slow death:
In Europe, yields are plummeting and Germany may soon be moved over to the left axis on this chart to join Japan:
The UST-Bund spread remains at an all time high:
Corporate spreads in Europe are steady:
Our bond volatility indexes are on the move again led by Europe of course:
FX:
It's been a one way bet on the USD recently no matter how you slice it:
But the USD isn't overvalued against any of the major currencies from a PPP perspective (save the yen):
Global FX volatility made a 2-standard deviation low a few months back, but now seems to be on the rise again:
Which might mean the VIX could follow along higher:
All the USD strength seems to be permeating the equity markets:
Justifying the counter cyclical outperformance:
Especially in Europe:
Commodity Market:
Commodities have had a tough go recently:
And the weakness has been widespread as our commodity diffusion index shows:
The downtrend in copper continues:
And WTI broke its trendline:
Gold is doing all it can to stay above $1200:
But silver is already on it's way lower:
Weeakness in commodities is not so good for EM stocks:
Our commodity volatility index put in a low recently: