Gavekal Capital: 2014-10-12

Friday, October 17, 2014

Stock Valuations Remain Near Record High Including in Europe and EM

Even as stock prices have corrected in recent weeks with only 36% of stocks having positive performance over the last 200 days and the average stock 19% from its one year high, we are reminded that stock valuations are still stretched pretty much everywhere. In the charts below we show the trusty price to cash flow ratio for the median stock in the developed world regions and also in the EMs. We highlight that even in areas of the market that have underperformed dramatically over the last four years (namely EM and Europe) the price to cash flow ratio for the median stock is still quite elevated relative to history.

image

image

image

image

image

Performance Snapshot: GaveKal Knowledge Leaders Emerging Markets Index

GaveKal Capital's Steve Vannelli discusses the GaveKal Knowledge Leaders Emerging Markets Index, explaining how stocks are selected for inclusion in the index and providing a new performance update.


Volatility Has Increased But Still Below Average Levels Of The Last Few Years

The 31-day standard deviation for the daily price change of MSCI World Index has increased from  a 20-year low of 0.27% in July to 0.59%. This puts it at the approximately the average level realized in 2013 but still well below the average levels since 2009. The most significant increase in daily volatility has been in North America as volatility has increased to seven-month highs.

image

image

image

image

Valuations Slow to Correct in MSCI Europe

A review of the percent of European companies in each sector that are trading above 7-year valuation averages reveals (with the possible exception of companies from the Energy group) a dearth of bargains throughout the region:

image
image
image
image
image
image
image
image
image
image
image

With the exceptions of Austria and Portugal, the results are similar on a country basis-- valuations for companies in MSCI Europe generally remain at elevated levels relative to 7-year averages:

image
image
image
image
image
image
image
image
image
image
image
image
image
image
image

Thursday, October 16, 2014

Late Cyclical (Dead Cat?) Bounce Today

While the DJIA finished slightly lower for the 6th consecutive day, the MSCI North America Index managed to squeak out a 20 bps gain. Late cyclical sectors were by far the strongest of the 10 sectors today.

image

This makes sense to us since these three sectors have exhibited the weakest momentum (i.e. most oversold) recently. For example, before today, only 7% of Energy stocks were trading above its 200-day moving average compared to 68% for the Utilities sector.

image

image

image

image

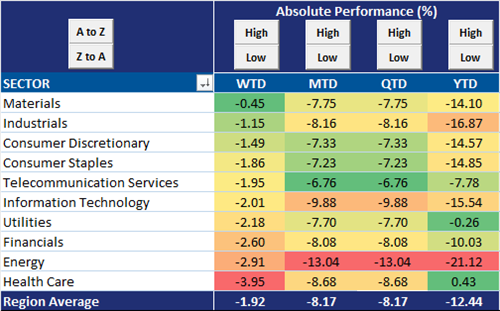
From a performance perspective, late cyclicals have also been the weakest sectors as well. Year-to-date, Energy and Industrials have been the worst performing sectors in North America and only another cyclical sector, Consumer Discretionary, has been worse than the materials sector.

image

Overall, we would not read anything into today's price action as the trend below seems strongly intact.

image


When the Strongest Sector in the Region Starts Breaking Down...

As the region's only positively performing group so far this year, MSCI Europe's Health Care sector has had a particularly rough week, falling nearly 4% so far:

image

Which sub-industries have been hit the hardest by the recent sell-off?  Pretty much all of them, with only minor losses/ a slight gain in what amounts to just three of the sector's individual stocks:

image

And, while the group has undoubtedly reached oversold territory, past experience shows that it can remain there for quite some time.  Looking at some of these market internals, a case could be made for the correction to worsen from here:

image
image
image
image
image
image
image
image

Has relative performance of European growth counter-cyclicals (a group comprised of health care and consumer staples companies) peaked?

image