
Profitability and investment are inextricably linked through time. A company's investment decisions today will ultimately drive its profitability level tomorrow. The fruits of a company's investment decisions eventually show up in profitability metrics such as free cash flow margin, operating cash flow margin, and return on equity. Finally. a company's ability to improve these metrics, year-in and year-out, ultimately dictates how a company's stock will perform over the long run.
The problem most investors face, however, is traditional financial statements only capture one investment aspect, tangible capital expenditures such as property, plant and equipment, of a company's investment profile. Traditional financial statements, due to overly conservative accounting practices that have been in place since 1974, completely miss the innovative investments a company makes in R&D, advertising, employee training and codified information. These intangible investments create the unique capital stock, or moat as Warren Buffet would put it, that produces future profits for companies in a knowledge-based economy. This obfuscation of knowledge investments by the regulatory body FASB has inadvertently helped to create the Knowledge Effect.
Grounded in academic literature over the past several decades, we split up the equity universe into two groups: Knowledge Leaders and Knowledge Followers. Knowledge Leaders are industry leading companies that follow a strategic innovation strategy while Knowledge Followers are companies that follow a mimicking strategy. In the data below, we quantitatively show our readers the differences between a innovative strategy and a mimicking strategy. For our discussion today, we have decided to simplify the analysis and look at only intangible investments such as advertising and employee training (also called Firm Specific Resources) and traditional investments in tangible capex. We are looking at over 2400 companies from the MSCI All-Country World Index using Gavekal's intangible-adjusted data.
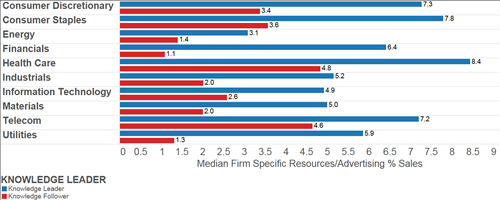
The median Knowledge Leader spends 6.5% of their sales on firm specific intangible investments versus only 2% for Knowledge Followers. Under current accounting practices, these investments are actually treated as expenditures and are immediately expensed on the income statement. However, we adjust the financial statements in order to properly account for the future benefits that this capital brings to the company. We adjust the financial statements by taking a portion of SGA expense, the account where firm specific investments are generally expensed in, and capitalize this asset to the balance sheet as a long-term asset. We treat this long-term intangible asset just as one would treat a long-term tangible asset by carrying it at historic cost and depreciating the asset over time which flows through to the income statement. The second table shows the median % of sales invested in firm specific investments broken out by sector. Knowledge Leaders in the consumer discretionary, consumer staples. health care, and telecom sectors spend the most on this type of intangible investments. There isn't a single sector where the median Knowledge Follower invests over 4.8%. In comparison, nine out of the ten Knowledge Leader sectors invest over 4.8% in firm specific investments.

Perhaps unsurprisingly, Knowledge Followers tend to spend more of its investment budget on traditional tangible investments. The median Knowledge Follower spends 5.6% of its sales on traditional capex while the median Knowledge Leader spends only 4.8%. In the second chart below, we break this out again by sector and here we can see where some major divergences occur between Knowledge Leaders and Knowledge Followers. The median Knowledge Follower energy company spends nearly 4x as much as the median Knowledge Leader on traditional capex. In the utilities sector, Knowledge Followers spend about twice as much on traditional capex as Knowledge Leaders. As we will see at the end of this post, this has profound impacts on profitability.


Before we look at the profitability of Knowledge Leaders versus Knowledge Followers, let's quickly analyze a balance sheet statement item. As we said above, after removing the intangible investment item from the income statement, we capitalize and create a long-term asset that is carried at depreciated, historic cost. We can see that below as we are looking at intellectual property as a % of total assets. Intangible assets make up nearly 14% of the median Knowledge Leader asset base, while intangible assets make up only 1.9% of the median Knowledge Followers asset base.


We began this post by stating that investment decisions and profitability are inextricably linked through time. Let us quantitatively look at this relationship now by measuring the free cash flow margins of Knowledge Leaders vs Knowledge Followers. The median Knowledge Leader has a FCF margin of 8.2% compared to only 3.8% for the median Knowledge Follower. A higher level of intangible investment leads to greater profitability for Knowledge Leaders. Above, we mentioned the energy and telecom Knowledge Followers invest far greater amounts in tangible investments than Knowledge Leaders in the same sector. The effect on the median profitability in these sectors is apparent. The median Energy Knowledge Leader has a healthy FCF margin of 8.5% while the median energy Knowledge Follower has a negative FCF margin. Similarly, the median utility Knowledge Leader has a FCF margin that is over 5x as high as the median utility Knowledge Follower.


At Gavekal we have created the Gavekal Knowledge Leader Indexes to track the most innovative companies in the world. They represent the first indexes to capture the Knowledge Effect. For more information please click here.